
It's a fact:
If you are a new ecommerce retailer, what you don't know about your store’s users could be hurting your business.
As tablet and small screen usage increases, it is becoming critical for store owners to track every step of the customer shopping experience from the first point of entry to the last-click behavior.
Thankfully, using Google Analytics data to measure your content's performance, you can determine what specific type of user behavior is generating a positive return on your content investment.
Whether you are an analytics newbie or a seasoned data nerd, here are 7 key metrics to manage and track your user behavior.
Table of Contents
What Makes Google Analytics so Great?
Google Analytics is not only a great way to monitor how much traffic your site is getting and where it’s coming from, but you can easily track your bounce rates, most popular pages or articles, and even your conversion rates.
The problem is, it can be really confusing to use.
There are various features of Google Analytics that are hidden amongst a variety of tabs, pages, and options, and many people don't even know the data is there, much less how to use it.
In this guide, you’re going to learn about some of the most important features of this service, and how you can use the data to improve your traffic and conversions.
Benefits of Using Google Analytics for Your Ecommerce Blog
Without knowing which blog posts are generating traffic and clicks, you can't measure the ROI of your content marketing efforts.
Once you integrate the analytics code on your blog, all your pageviews will be tied to actual sessions, allowing you to connect your traffic sources to a specific marketing channel.
Google Analytics can provide important information such as:
- How many users visit your blog each day, week, or month?
- How long do readers stay on your site before clicking away?
- How many pages do people typically view in a single visit?
- How are readers finding your blog?
- What blog posts are the most popular?
- How many of your posts are causing people to bounce back to the SERPs or leave your site?
- What are your reader demographics (age, gender, interests, etc.)?
Getting Started with Google Analytics
You'll need to have the Google Analytics tracking code installed on your blog. You'll use this data to optimize your site's content and give your readers the best possible user experience.
If you don’t have a Google Analytics account, and use WordPress for your CMS, here are a few simple tips to help you get started.
- Visit https://analytics.google.com/analytics/web/ to sign up.
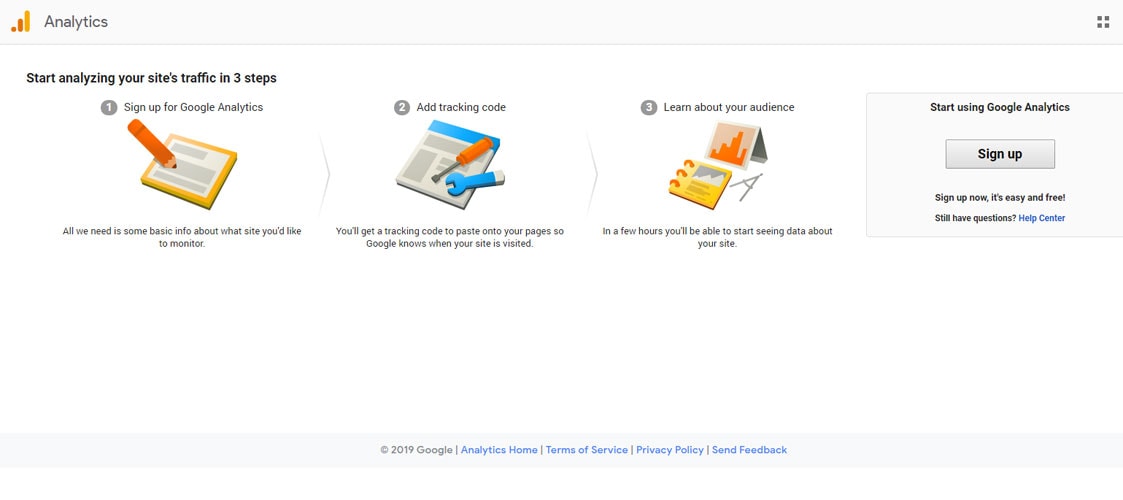
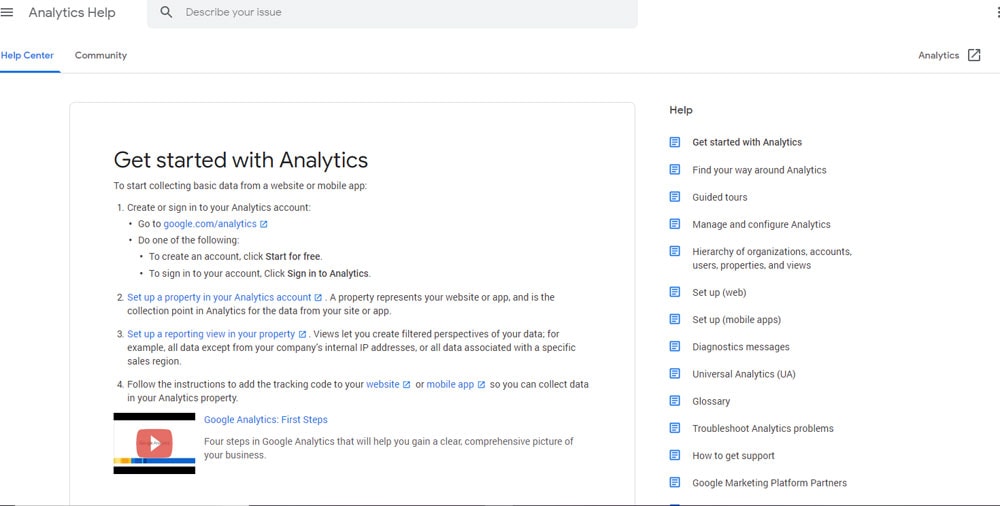
Next, you'll need to add your site to Google Analytics. To do this, visit Google’s getting started with Analytics page.
If you’re using WordPress, as I do on my network of fashion and beauty blogs, you can use a plugin to install Analytics on your pages. This step is important if your theme doesn't have a specific place designated for you add your Analytics code.
I use the Google Analytics Dashboard for WP plugin.
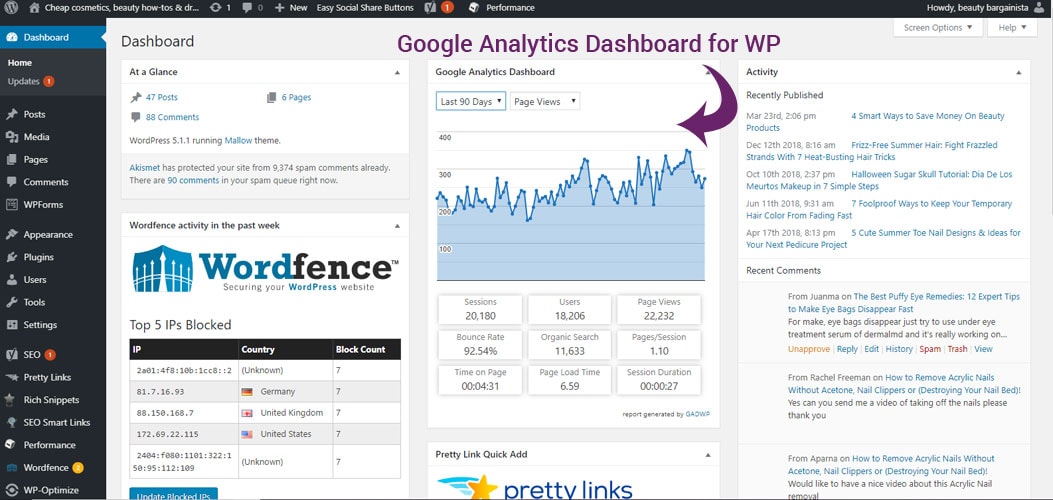
This plugin will connect to your Google Analytics account and let you choose which website you want to track and will then add your Analytics code automatically to all of your posts and pages.
Here is what you need to know about this plugin:
- It’s free and easy to use.
- The data reports, in real-time, in your dashboard screen.
- You can view up to 90 days worth of search analytics data inside WordPress.
- You can also track downloads, outbound links, and page scrolling depth.
- It connects to your Google Analytics account in 30 seconds or less.
- You can view your pageview, sessions, bounce rate, 404 errors, traffic, and referrers from the WordPress dashboard.
- It’s easy to toggle between the various data configurations in the widget, too.
I prefer this plugin over the Google Analytics WD and the Google Analytics for WordPress by MonsterInsights because it's easier to use.
You can download the plugin here: Google Analytics Dashboard for WP
7 Google Analytics Website Metrics to Track User Interactions
Are you looking from more traffic, unique visits, content engagement, clicks to your product pages or retention?
The data points you track in Google Analytics depend on your end goal.
No matter what you are looking to measure brand visibility or traffic from SEO, Pinterest or Instagram, here are 7 of the best metrics you can start using to increase your traffic and income.
- Page Views – Tracking the number of pages that your visitor’s view is an important metric. With this data, you can identify which web pages resonate best with your customers.
- Unique Visits – This metric measures the number of total monthly visitors to your website, not the total number of clicks or hits to your store.
- Bounce Rate – This data point indicates how many visitors coming from an external traffic source (banner ads, pay-per-click, social media accounts or organic search) viewed a single page of your site and then left the page. A high bounce rate indicates that there might be a lack of engaging content on the page or the page does not match the user’s intent.
- Percentage of New Sessions – This metric tells you what percentage of your sessions
comes from new visitors to your site. Ideally, you want to reach new people but also create content that gets them to keep returning back to your site. - Site Entry Points and Site Referrers – With site entry point data, you’ll learn the exact pathway that users entered the site. The site-referring page is the URL of the previous web page from which a web link was followed. For example, if a web visitor clicks-through from a product image on Pinterest, the Pinterest URL is included in your site referring data.
- Type of Web Browser Used – If you are optimizing for the small screen, mobile phones and tablets should be your targets. If most of your shoppers are using mobile browsers, you will have to update your website to a responsive or mobile template to create a seamless shopping experience for mobile users.
- Referrals. A referral helps you identify which websites drive traffic to your blog. The Referrals Report in Google Analytics helps you identify traffic sources such as Facebook, Pinterest, and Twitter so you can increase your content promotion efforts on these platforms.
Conclusion
Without web analytics data, ecommerce shop owners cannot determine how shoppers are interacting with their blog content, why they leave the site or what drives them to buy.
By using analytics to track user behavior, you can split-test multiple blog post pages or test new product offerings for user responsiveness.
Most importantly, your analytics data should give you insight into what pieces of content actually lead to sales on your website versus what type of articles are popular or trending online.
If you have any tips, tricks or questions on how you use Google Analytics for your store's blog, I'd love to hear your thoughts. Or if you have a GA dashboard that can help with ecommerce blog analytics, drop your link in the comments below.
Comments are closed.